Table of Contents
Once models are deployed, continuous monitoring is essential to ensure they perform as expected in a live environment. This involves tracking performance metrics such as latency, throughput, and error rates in real-time. We utilize Google Cloud Monitoring to set up custom dashboards and alerts that help in proactively identifying and resolving issues. This approach not only helps in maintaining the reliability of our models but also ensures that they continue to meet the required accuracy and performance standards over time.
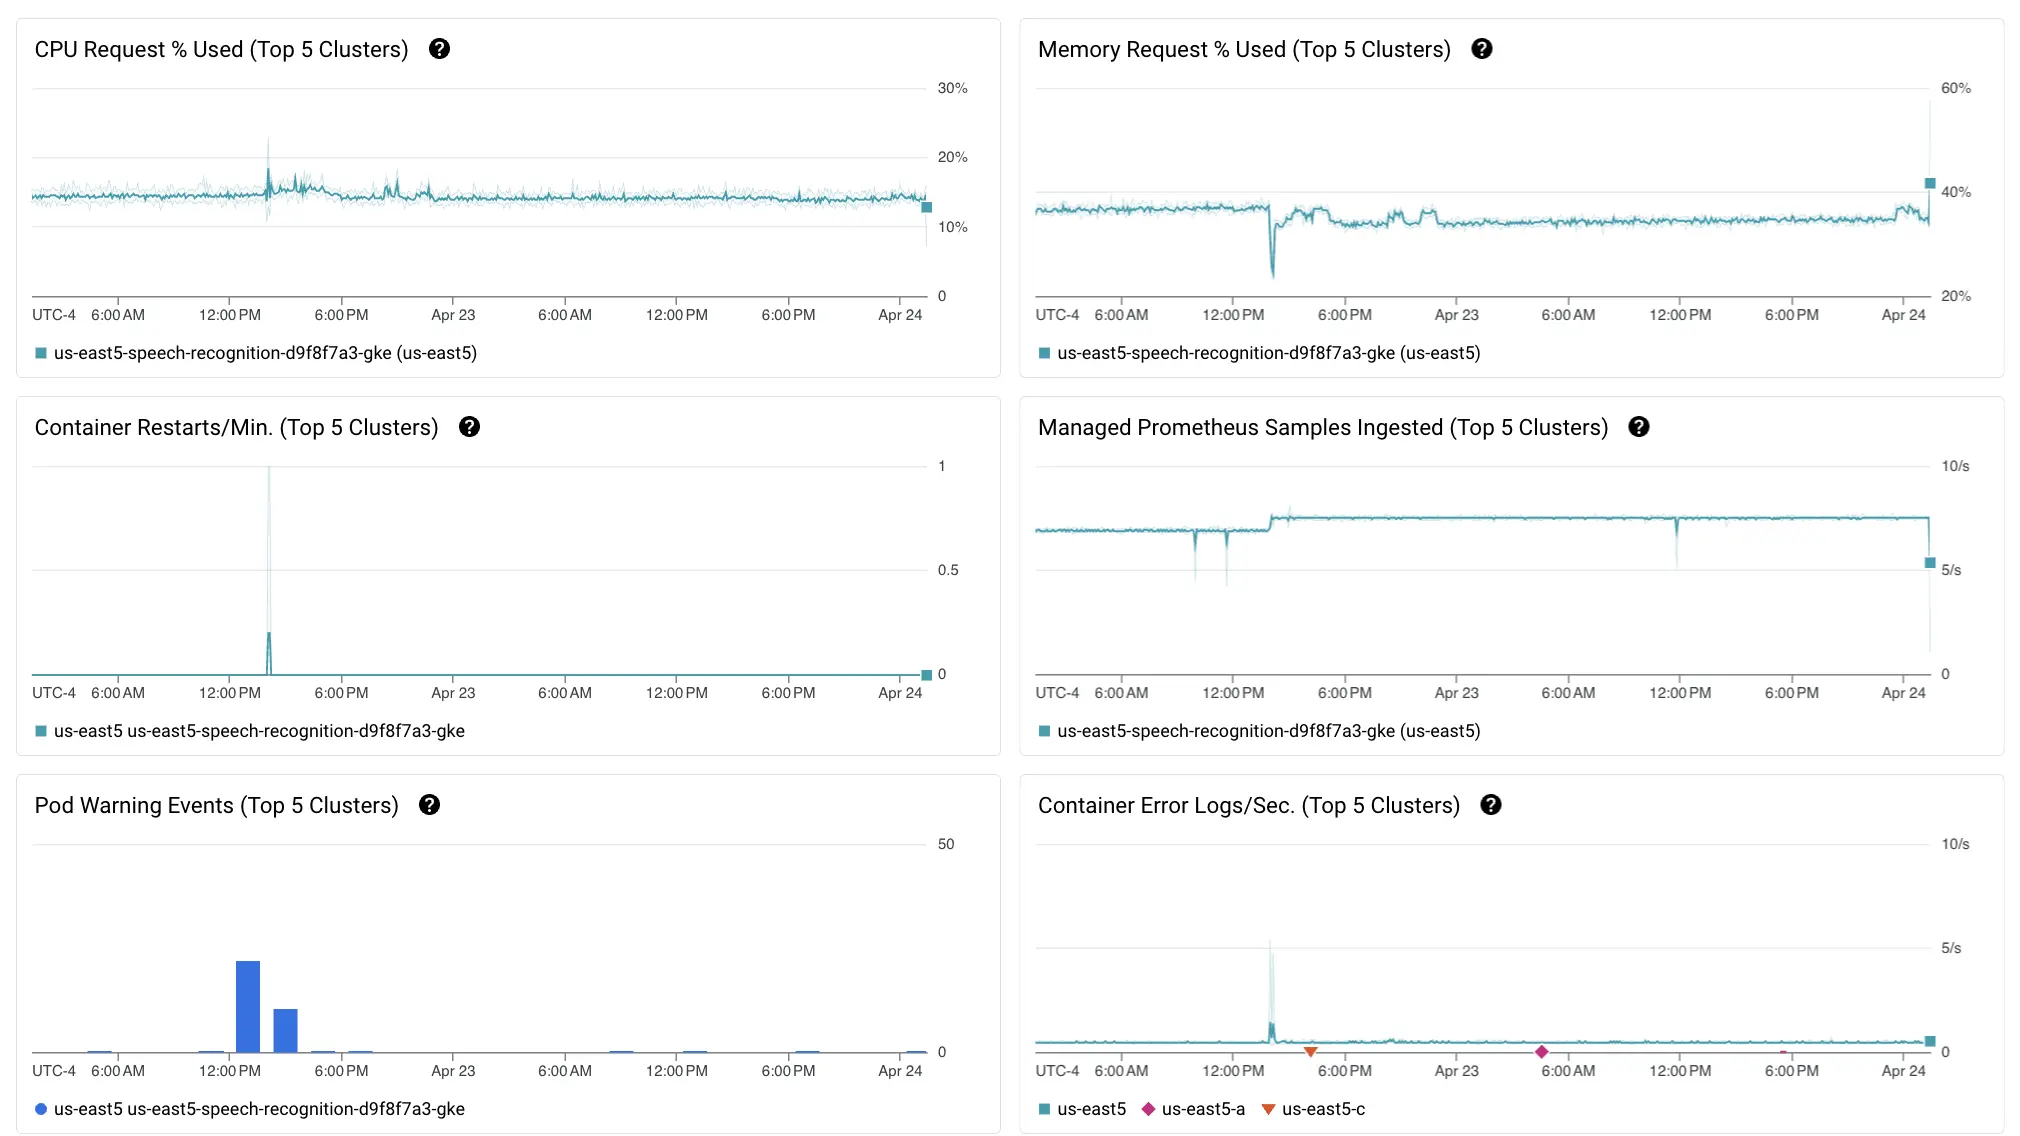
1. Cluster Health Monitoring
Our deployment architecture is built on Cloud Composer running on Google Kubernetes Engine (GKE) backend, which provides robust, scalable management for containerized applications using Kubernetes. To oversee the health and performance of these clusters, we leverage Google-managed services such as Prometheus, which is integrated into GKE as part of Google Cloud Operations suite. Prometheus allows us to collect and store metrics as time series data, providing valuable insights into the health and performance of our clusters. Below are the list of Key Performance Indicators (KPIs) and metrics used to monitor them:
- Memory Usage and Utilization
- KPI: Monitoring memory usage to ensure the service stays within allocated limits.
- Metrics:
- Memory Utilization (%): Shows peaks and average memory usage over time.
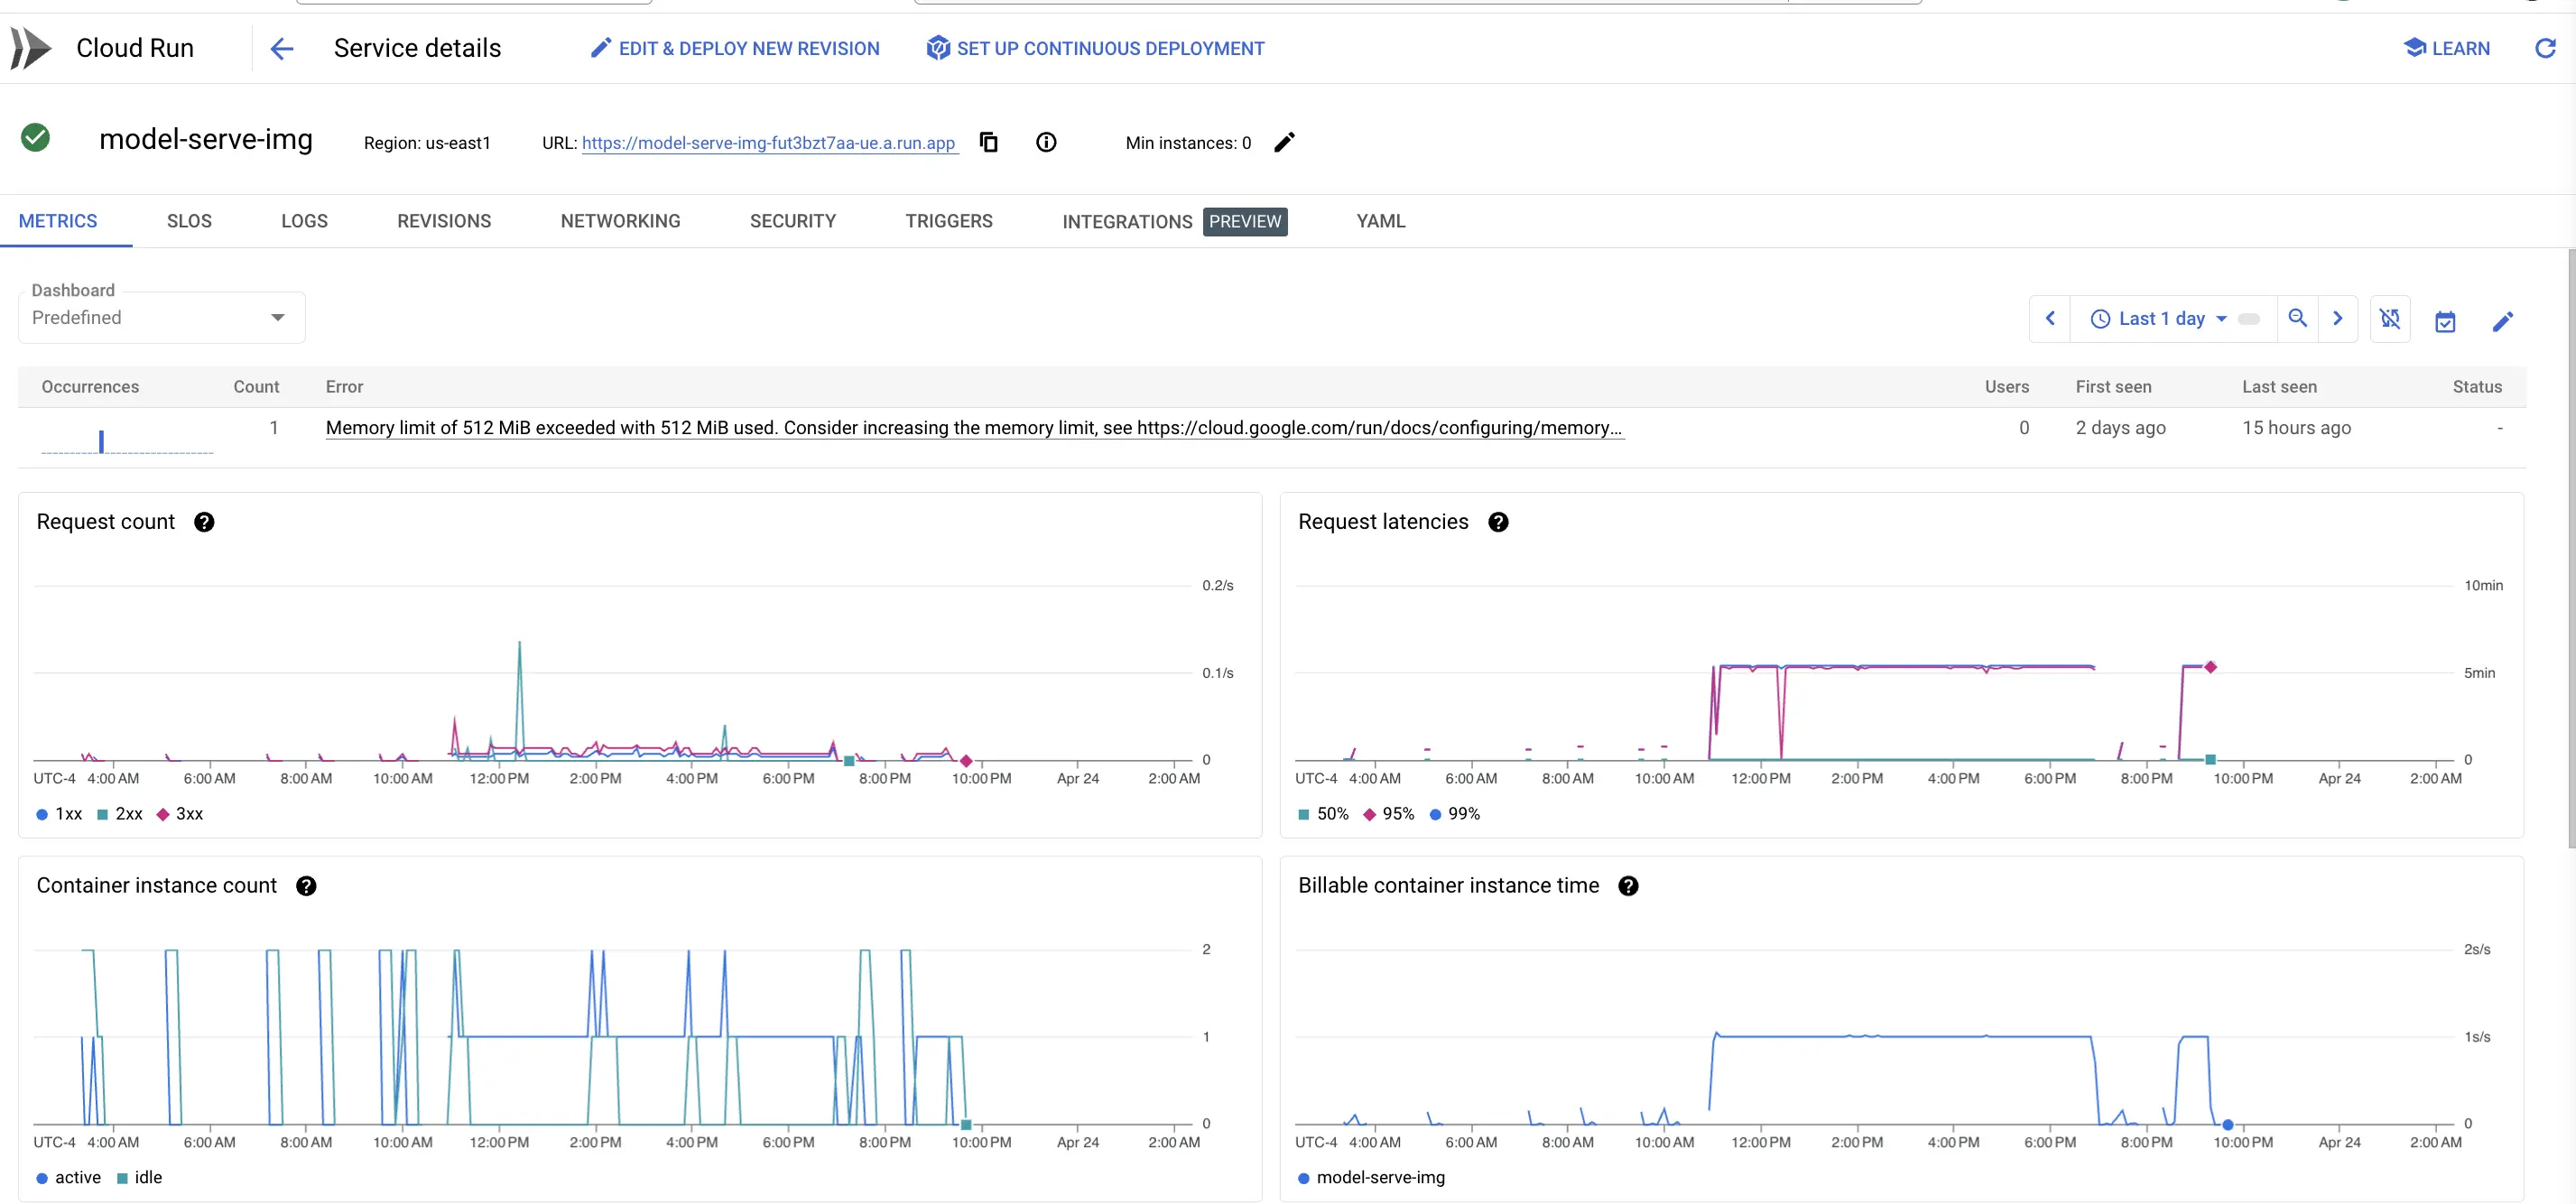
- Memory Limit Exceeded: Indicates when memory usage exceeds the set limit, which can lead to service crashes or performance degradation.
- Request Metrics
- KPI: Assessing the volume and performance of HTTP requests handled by the service.
- Metrics:
- Request Count: High request counts indicate heavy usage; breakdown by status codes helps identify potential issues (e.g., many 5xx errors).
- Request Latencies: Measures the time taken to process requests. Lower latencies indicate better performance.
- Container Instances
- KPI: Ensuring sufficient instances are running to handle the load without over-provisioning.
- Metrics:
- Instance Count: Tracks the number of active versus idle instances, helping in scaling decisions.
- Billable Instance Time: Helps manage costs by tracking the duration instances are billable.
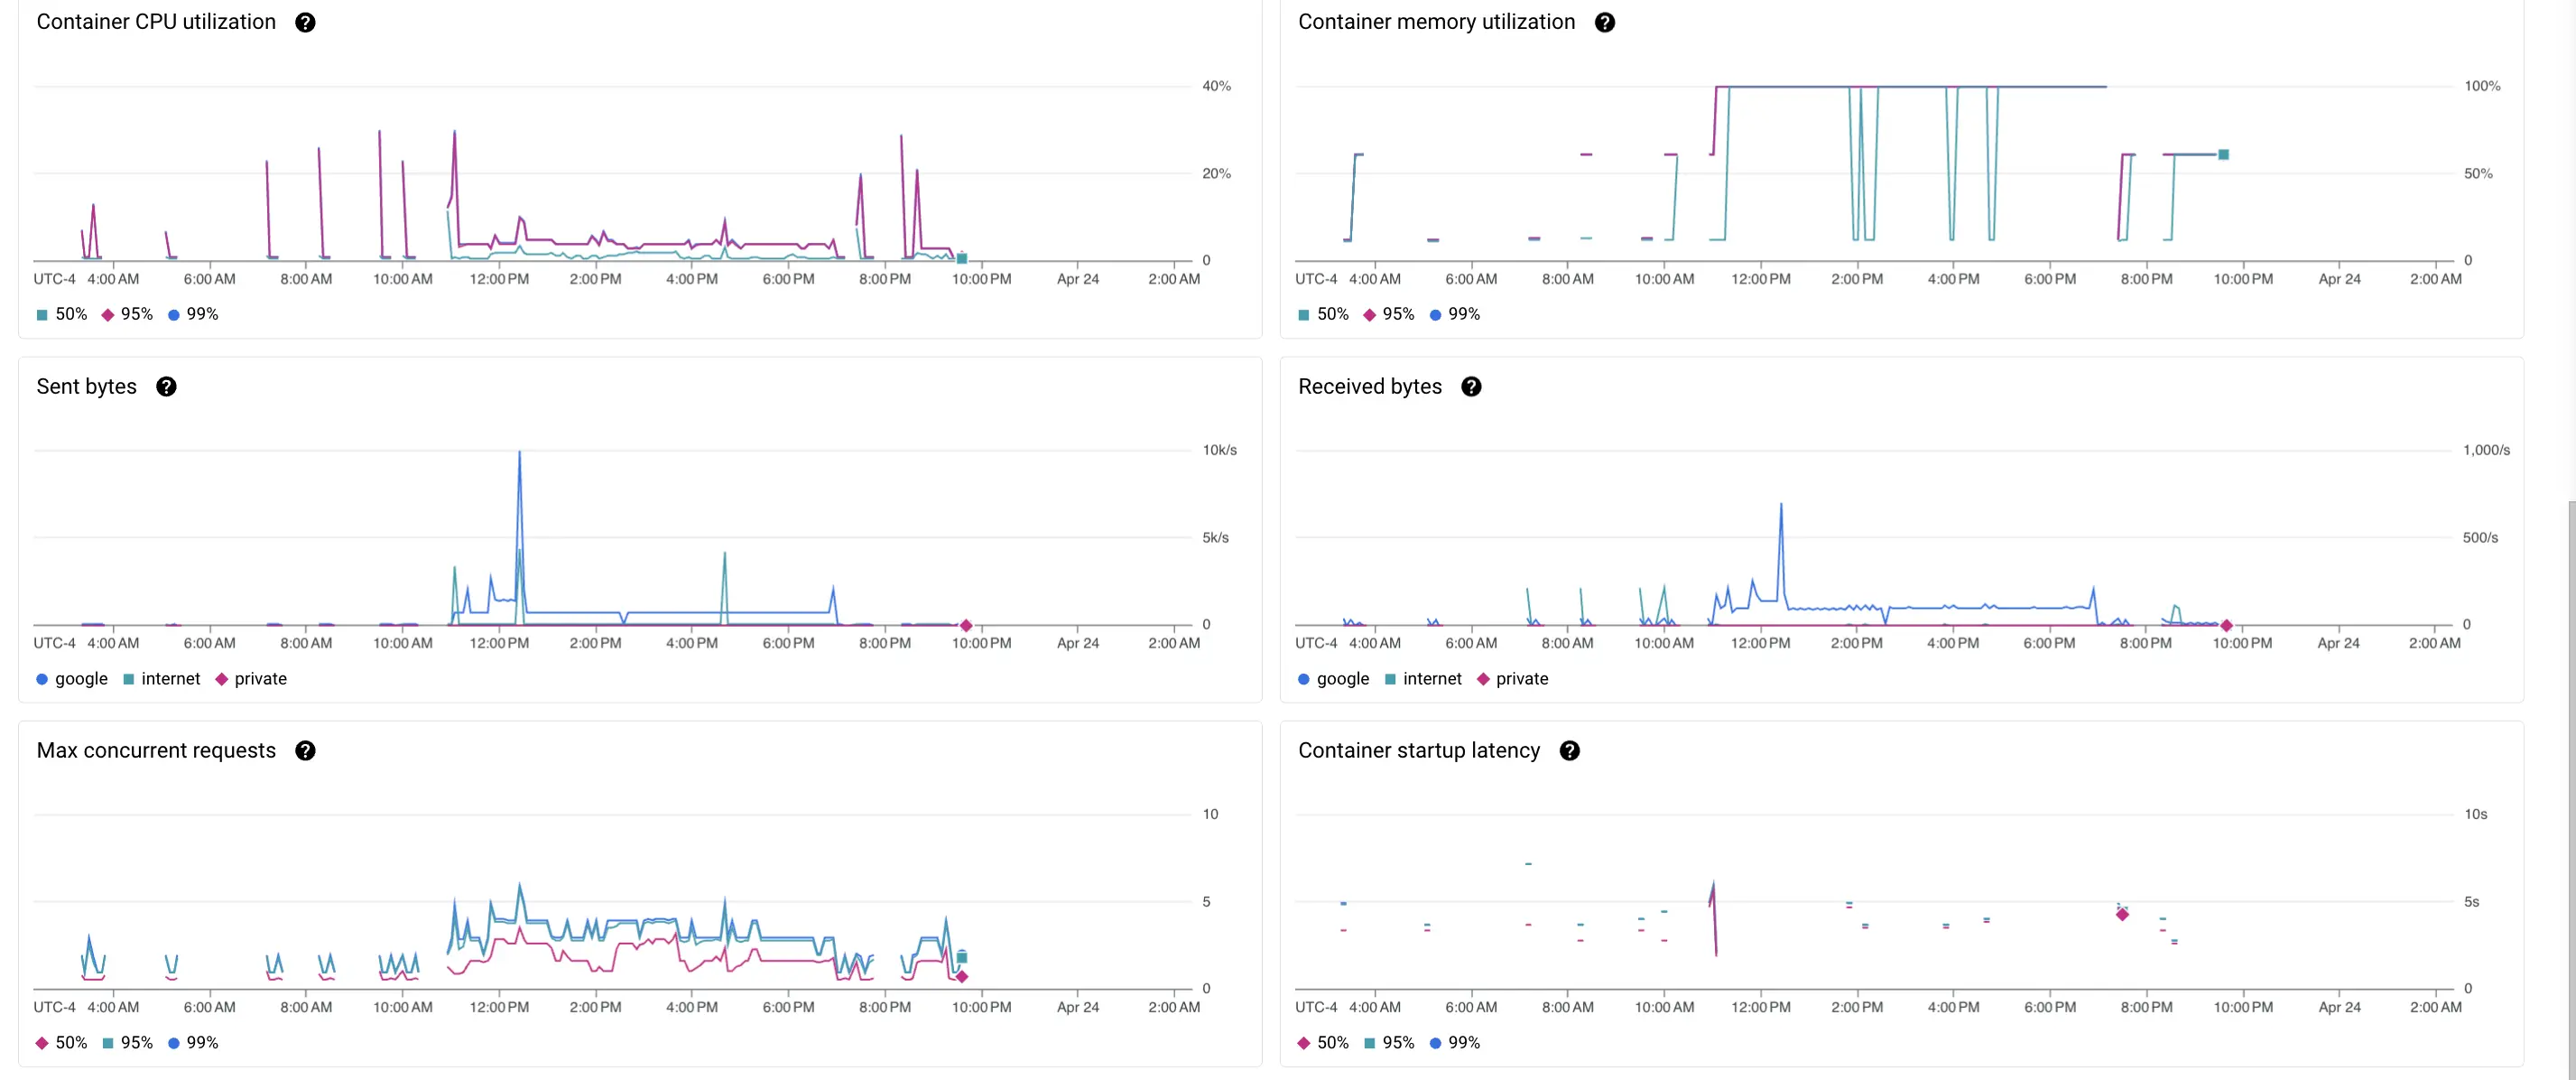
- CPU Utilization
- KPI: Optimizing CPU usage to balance performance and cost.
- Metrics:
- CPU Utilization (%): Monitors how much CPU is used, helping to identify if the service is over- or under-utilized.
- Data Transfer Metrics
- KPI: Monitoring data throughput to ensure that the network can handle the load.
- Metrics:
- Sent Bytes: Amount of data sent by the service.
- Received Bytes: Amount of data received by the service.
- Concurrency and Latency
- KPI: Ensuring the service can handle concurrent requests efficiently and starts new instances quickly when needed.
- Metrics:
- Max Concurrent Requests: Indicates the load in terms of simultaneous requests.
- Startup Latency: Time taken for new instances to become ready, impacting the ability to scale quickly.
2. Monitoring and Dashboard Setup
This setup enables us to:
- Monitor Resource Utilization: We can track CPU, memory, and storage usage across all nodes in the cluster to prevent overallocation or bottlenecks.
- Alerts for Anomalies: We can configure alerts for abnormal behaviors, such as spikes in resource usage or unexpected downtimes, ensuring quick response times to potential issues.
- Visualize Metrics: We use Google Cloud’s built-in dashboard tools to create visual representations of our monitoring data, making it easier to understand and react to metrics.
- Automate Responses: We also implement automated scaling and balancing based on the workload demands and predefined rules in response to real-time metrics, improving the resilience and efficiency of our applications.